When GA4 first launched, we recapped five big changes GA4 users could expect. Now that we’ve had in-depth experience within the platform, we've identified four more changes that business users and marketers need to know about.
Whether you're still getting accustomed to the new platform or are still waiting to switch, here's what to look out for:
1. The bounce rate is dead
GA4 finally dispenses with the bounce rate, which has long been one of the most quoted but misunderstood metrics in web traffic analytics. Instead, Google is now offering what it calls its engagement rate metric to better reflect how users interact with your site.
As a quick refresher, bounce rate measured users who only visited a single page on your site before leaving. That may have been a useful metric for an ecommerce site relying on users browsing multiple pages of inventory, but it could also penalize news sites and long-form blogs, where users spend a lot of time reading a single page and leave after they’ve found their answer.
Engagement rate is built upon the concept of an “engaged session,” which, according to Google, is a session that:
- Lasts for 10 seconds or longer
- Records one or more conversion events
- Includes two or more page views
Engagement rate is then defined as (engaged sessions)/(sessions).
Astute GA4 users will notice the new metric is the inverse of the old bounce rate. If your previous bounce rate was 60%, your engagement rate will be 40%, which we believe offers a more accurate and positive picture of how users are interacting with your site.
2. More accessible conversion paths
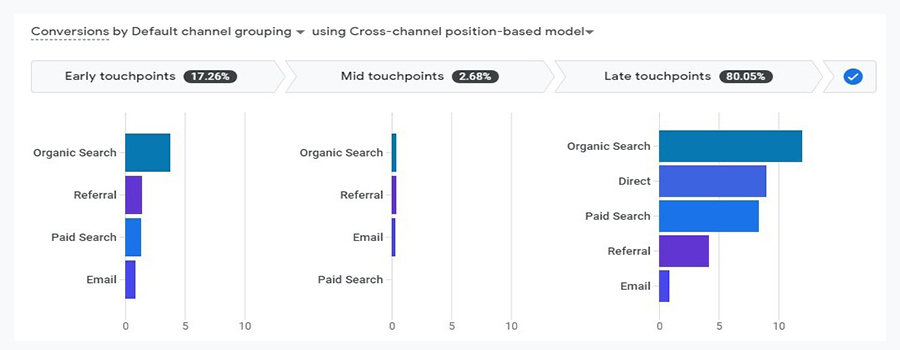
Previous versions of Google Analytics included the ability to track the paths users took to a conversion and model different attribution types, but GA4 consolidates that data and makes it easier than ever to understand how your various marketing efforts work together (or don’t) to drive sales and clicks.
GA4’s Conversion Paths report shows at a glance which marketing channels initiated, assisted and closed the most conversions, along with more granular data on purchase revenue, days to conversion and the number of touchpoints it took to convert.
Did you customers begin their conversion journey through an organic search or paid ad? What channel ultimately helped secure the sale? This report can help you visualize and optimize those conversion paths.
3. Easier attribution modeling
GA4 also simplifies the process of comparing different attribution models, which can be helpful when it comes to fine-tuning your marketing mix.

In case you’re new to attribution models, they are essentially rules or data-driven algorithms that assign credit for conversions to different clicks and events along the user’s journey. In GA4, these include:
- Cross channel first-click: Gives all credit for a conversion to the first channel a customer clicked
- Cross-channel last-click: Gives all credit to the last channel a customer clicks
- Cross-channel linear: Distributes credit for a conversion equally across all channels a customer clicks or engages with before converting
- Cross-channel position-based: Attributes 40% credit to the first and last interactions, and then evenly to those events in the middle of the journey\
- Time decay: Gives more credit to touchpoints that happened closer to the final conversion.
- Ads-preferred last click (NEW): Gives 100% of the conversion value to the last Google Ads channel the customer clicked before a conversion.
The platform’s Model Comparison tool shows you how conversions and revenue would increase or decrease for particular channels, based on the attribution model you’re using. Maybe you could save money on paid ads, or need to boost your email marketing efforts—GA4 can help you find those nuggets among your data.
4. Fully customizable reporting
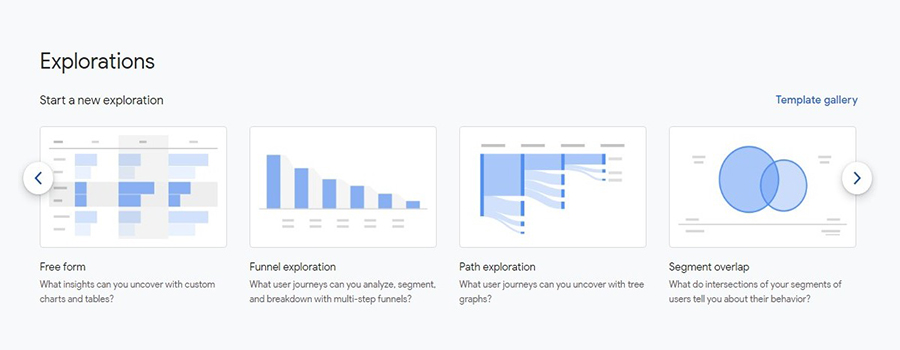
GA4 includes a host of visual reports called “Explorations” that can help you uncover new insights. The platform includes a number of templates that draw directly from your visitor data, or you can build totally custom charts and tables that drill into specific segments, user journeys and activity.

Does your sales funnel look different to people from one segment versus another? Where are users getting stuck or leaving your funnel? What areas of overlap exist among your various customer segments? GA4 can help you build eye-catching reports that drive results.
Have more questions about transitioning from Universal Analytics to GA4? Reach out to Informatics’ analytics experts today—we’re kind of obsessed with data.

