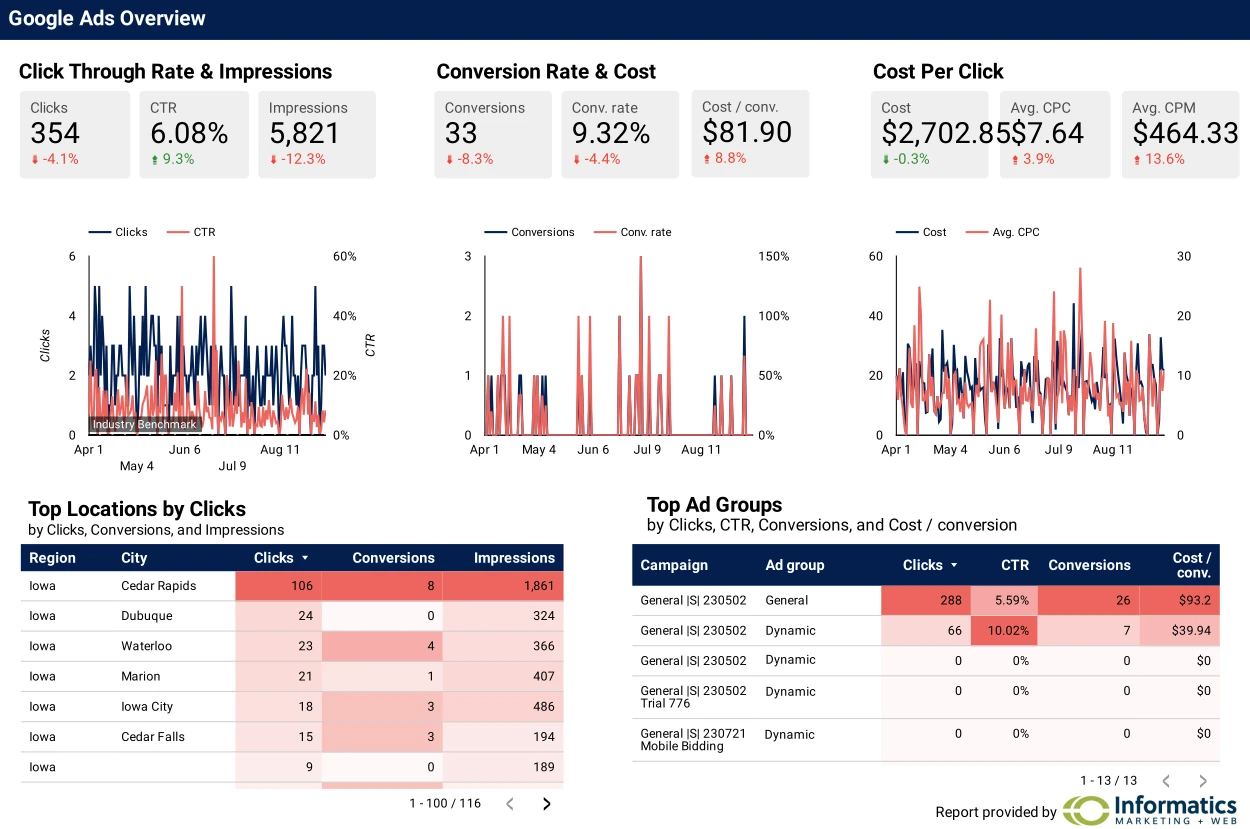
If you’re a reader of the Informatics blog, you know that data is everything when it comes to digital marketing—after all, you can’t deliver results if you don’t know where you’re starting. But raw data, scattered across different databases, isn’t exactly useful, either.
You need a dashboard that sorts and compiles all of your data together in one place, so it can be easily referenced at any time.
Here at Informatics, we use Google Looker Studio for this work, and create custom dashboards for all of our digital marketing clients. Here’s why we think you should, too.
A Quick Introduction to Google Looker Studio

Think of Looker Studio as your own personal data analyst. It's a powerful, free visualization tool that allows you to create interactive reports and dashboards by pulling data from different sources. Other essential Looker Studio functions include:
- Data Blending: Combine data from multiple sources into a single report or dashboard.
- Data Exploration: Explore and analyze your data to uncover insights and trends.
- Customizable Templates: Use pre-built templates or create your own to streamline the dashboard creation process.
- Real-time Updates: Automatically refresh your dashboard with the latest data.
- Collaboration: Share dashboards with colleagues, clients, contractors, or other stakeholders for easy access and collaboration.
- Scheduling: Schedule reports to be sent automatically at regular intervals.
- Integration: Connect to other Google Workspace tools like Sheets, Docs, and Slides.
Google Looker Studio’s Integration features are key to its utility, because in addition to Workspace tools like Sheets, Docs, and Slides, the platform also simplifies data imports from a wide range of external sources:
- Google Analytics: Track website traffic, user behavior, and conversions.
- Google Ads: Analyze ad performance and ROI.
- BigQuery: Access large datasets stored in Google Cloud Platform's data warehouse.
- MySQL, PostgreSQL, and other databases: Connect to popular relational databases.
- CSV, Excel, and other file formats: Import data directly from various file types.
- Google Search Console: Monitor website search performance.
- YouTube Analytics: Analyze YouTube channel performance.
- Google My Business: Track business performance and customer reviews.
- Social Platforms: Pull in follower and activity data from your preferred social accounts on Facebook, Instagram, LinkedIn and more.
This is hardly a comprehensive list; Google lists more than 1,050 connectors currently available to integrate datasets with Looker Studio.

5 Benefits of a Custom Looker Studio Dashboard
Still not sold on the need for a custom data dashboard? Here are five ways a data dashboard can benefit your organization:
Boost Efficiency and Productivity
A well-designed dashboard can save you time and effort by providing quick access to the information you need, while also allowing you to edit out the sources you don’t. No more digging through spreadsheets or piecing together reports—it's like having your own personal data butler.
Level Up Your Storytelling
Data is great, but it’s even better when it tells a story. A customized dashboard can help you create compelling narratives that resonate with your audience. That audience might be internal or it might be external. Either way, the odds are you are telling that story to inspire colleagues or customers to take action.
The American Management Association offers some compelling research on the persuasive powers of data visualization:
- Compared to a control group with no visual aids, 64% of participants in one study made immediate decisions when given a visual map.
- Visual aids can shorten meetings by 24%.
- Visual aids can increase a presentation’s perceived credibility up to 43%.
Even if the purpose of your story is education rather than persuasion, visuals can’t be overlooked. Two-thirds of the population identify as visual learners, versus only 30% as auditory learners. If you aren’t communicating through visuals, you aren’t reaching the majority of your audience.
Generate Content
What happens when you analyze your data and see that your team has achieved a big win? You could just write a pithy social media post, or you could use data visualization—like a graph of year-over-year sales, or a timeline that depicts positive trends—to make it easy for your audience to understand your journey.
Visualization doesn’t just aid understanding; in the social sphere it also boosts engagement.
Posts including images have 94% more views, 150% more engagement, and a 27% increase in click-through-rate.
Stay Fresh
The business landscape is constantly evolving. There is no single digital marketing tool where you can “set it and forget it.” Strategies, tools, and reporting measures must constantly be established, evaluated, and revised. Customizing your dashboard today gives you an opportunity to hypothesize what your most valuable Key Performance Indicators are, and to refine those over time.
Make it Yours
If you really want to take your custom dashboards to another level, consider enabling Looker Studio's Private Label functions. This is especially useful if you want to build visualizations for distribution outside of your organization. Enabling Private Label services allows users to “blend the look and feel of Looker with your branding.”
So stop “looking” and take action. Build your customized Google Looker Studio dashboard today, or partner with us to have it done for you—either way, you'll level up your data game and be ready to capitalize on the next big trend for your business.
Ready for your custom data dashboard?
Our Digital Marketing experts can get you up and running now.

